Explore Google Cloud Resources and Costs
After connecting Google Cloud to SpaceONE, you can explore and analyze resources and costs.
[Resource Exploration] Cloud Services
The Cloud Services page allows you to comprehensively view and understand various cloud resources collected through collectors.
Navigate to Cloud Services
Go to [Asset Inventory > Cloud Services] page and select Google Cloud from the [Provider] field on the left.
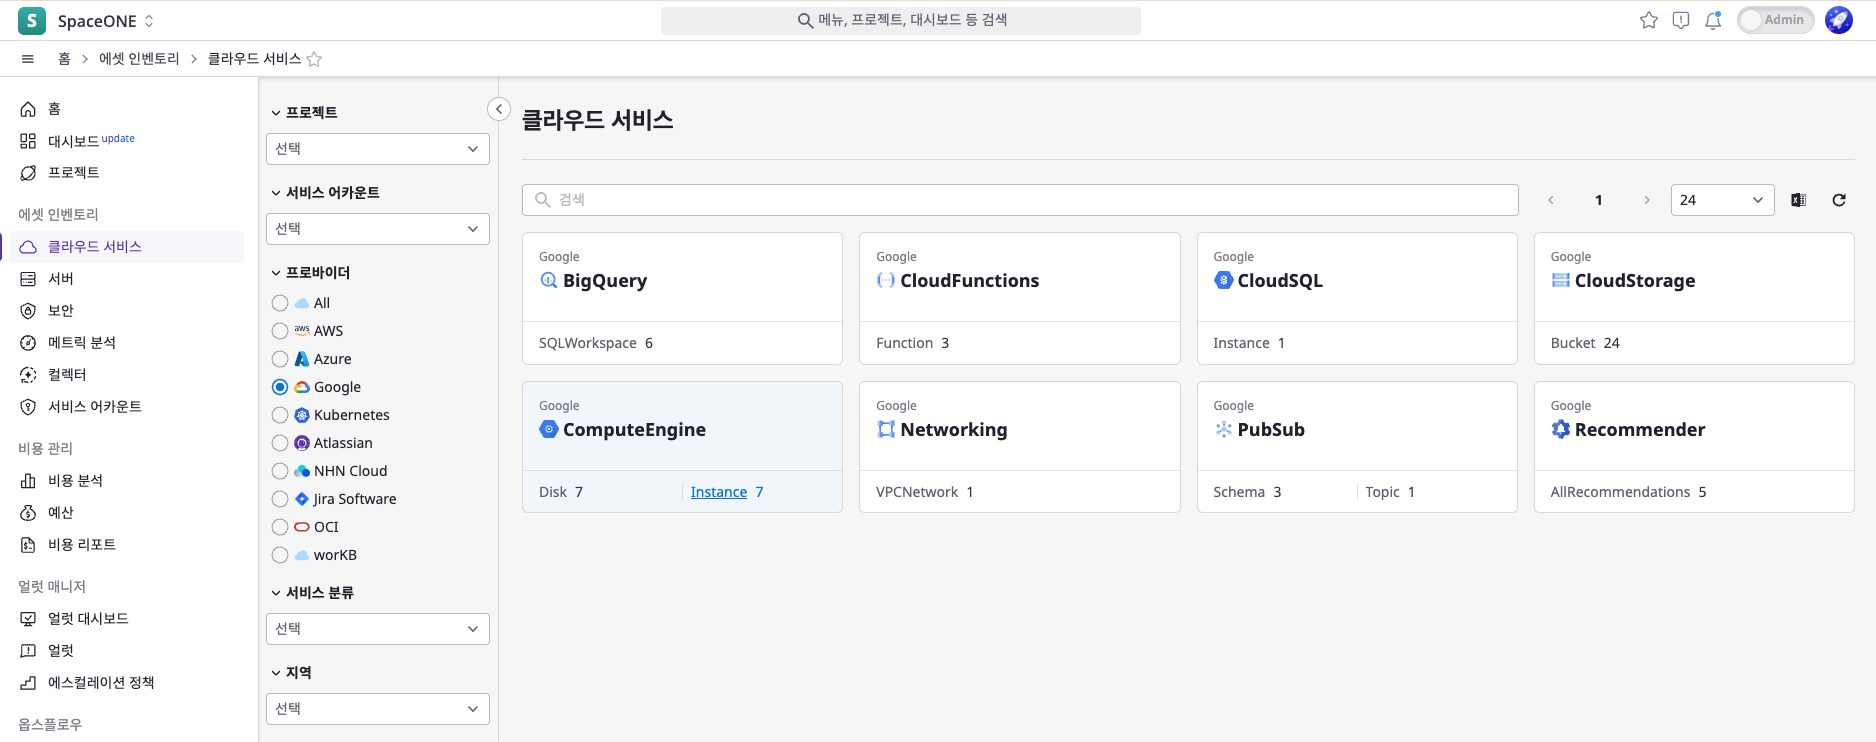
Explore Specific Services
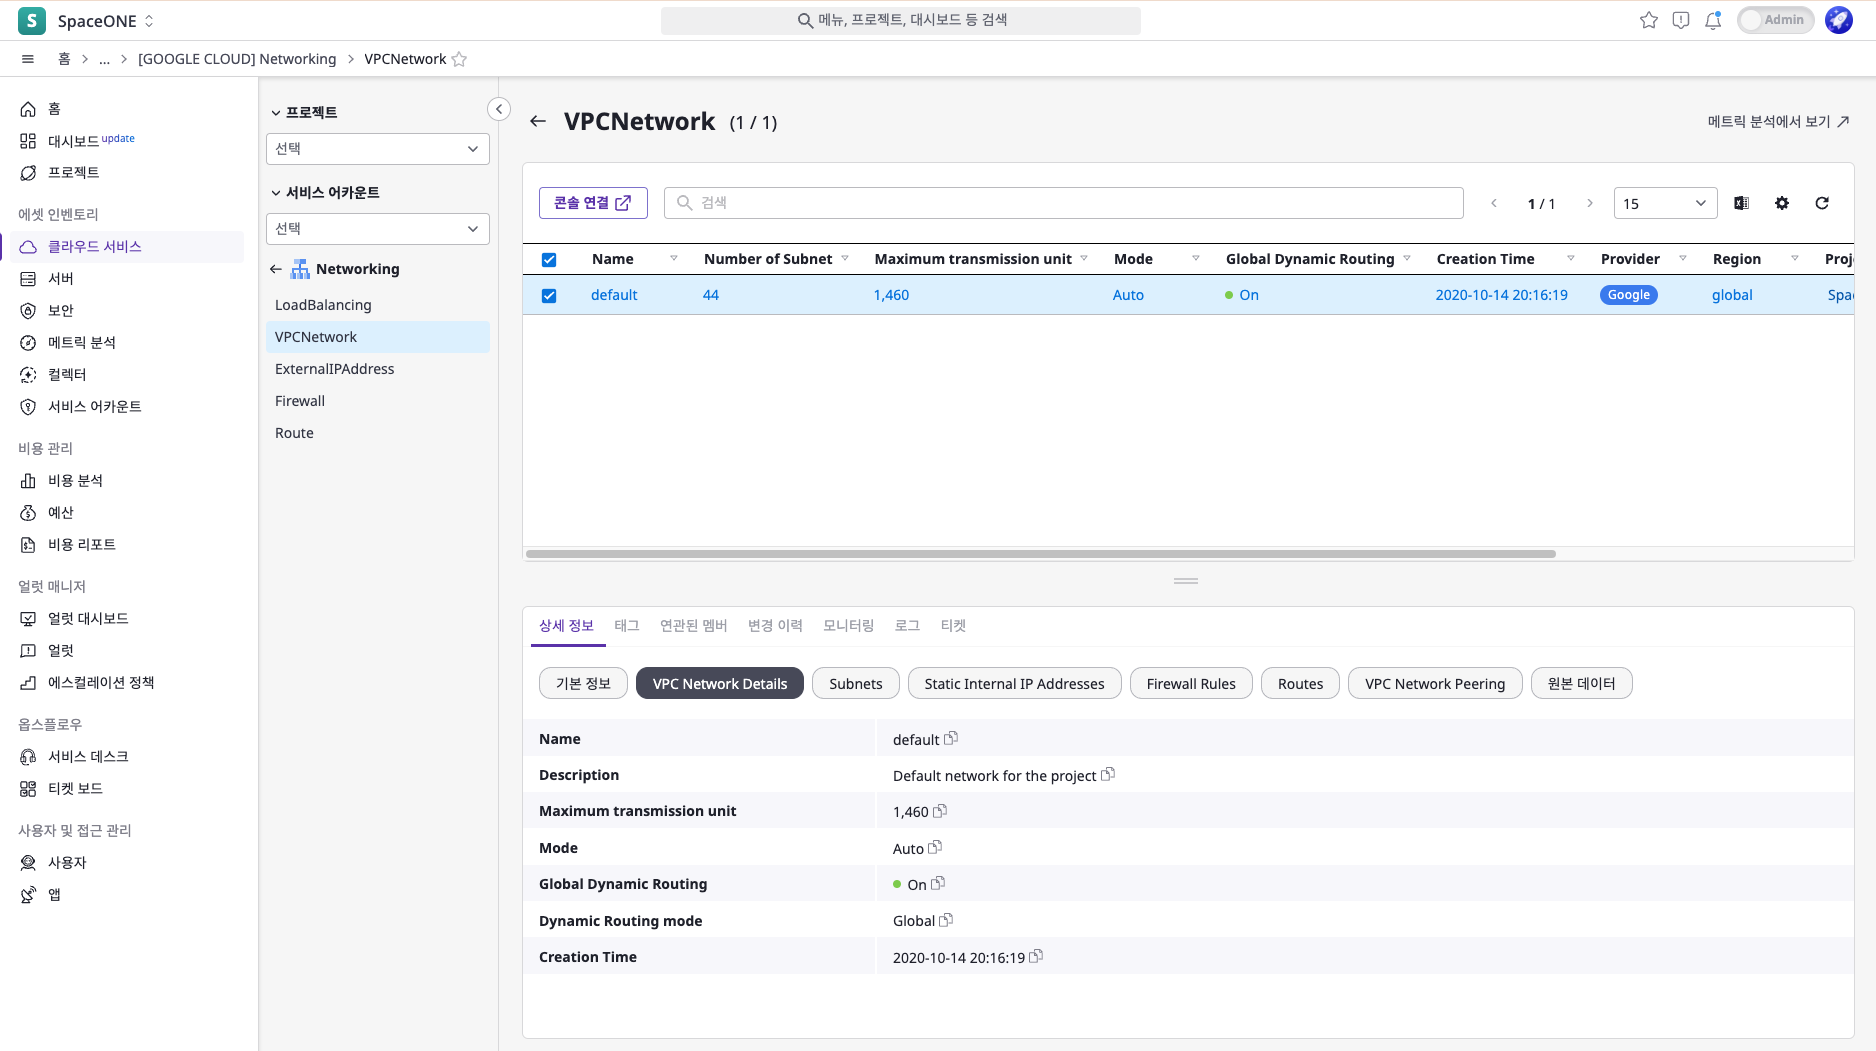
Click on a specific service to view its resource data and status.
[Resource Exploration] Metric Analysis
The Metric Analysis page allows you to quickly and intuitively explore resources in use and easily view all data through visualized charts.
Navigate to Metric Analysis
Go to [Asset Inventory > Metric Analysis] page.
Select Google Cloud Namespace
Select one of the sub-namespaces under Google from the [Namespace] list on the left.
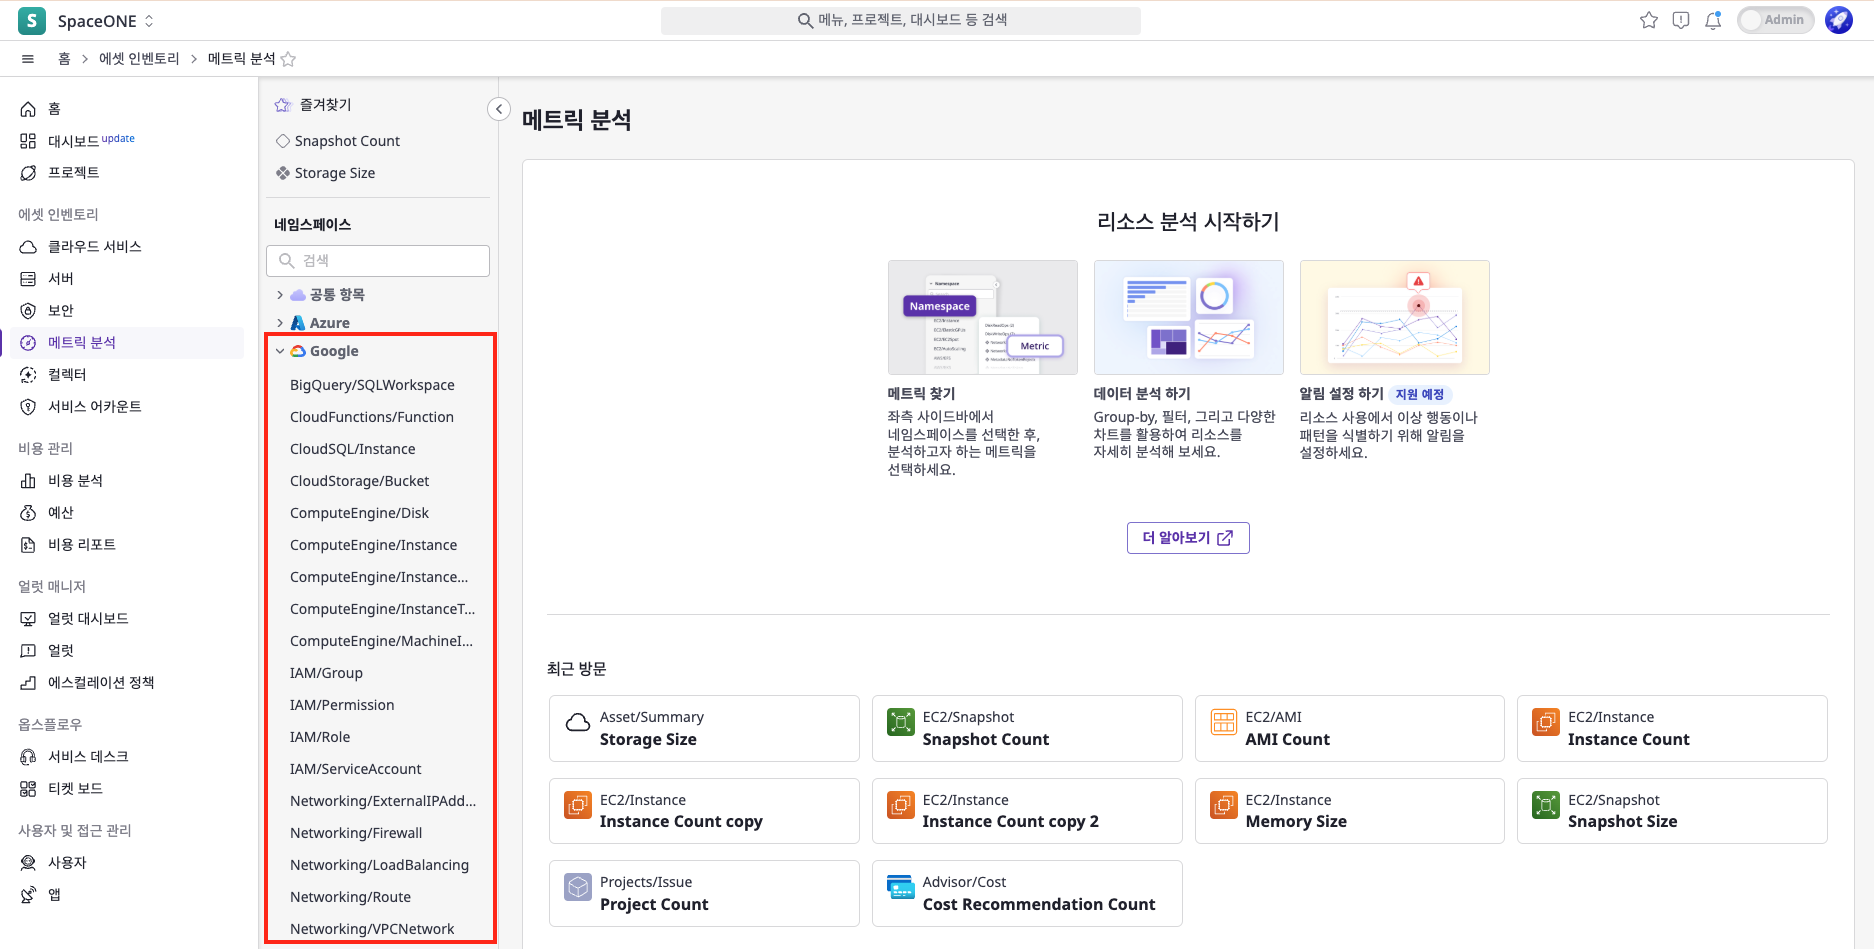
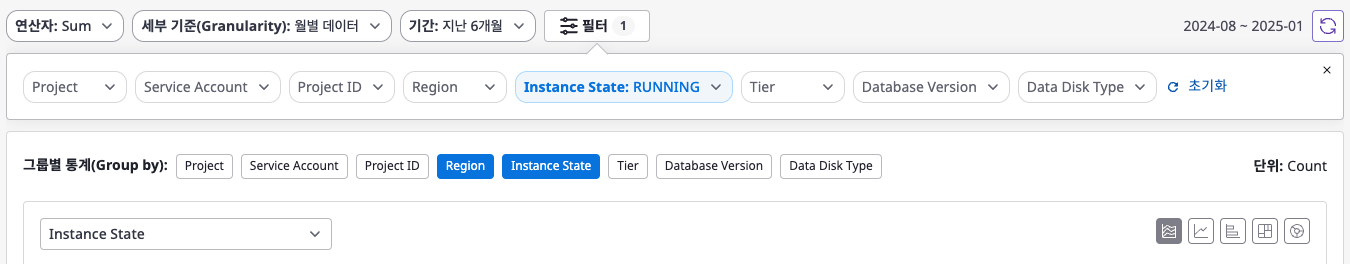
Select Metrics and Set Options
After selecting a namespace, metrics for that namespace appear in the left list. Select your desired metric.
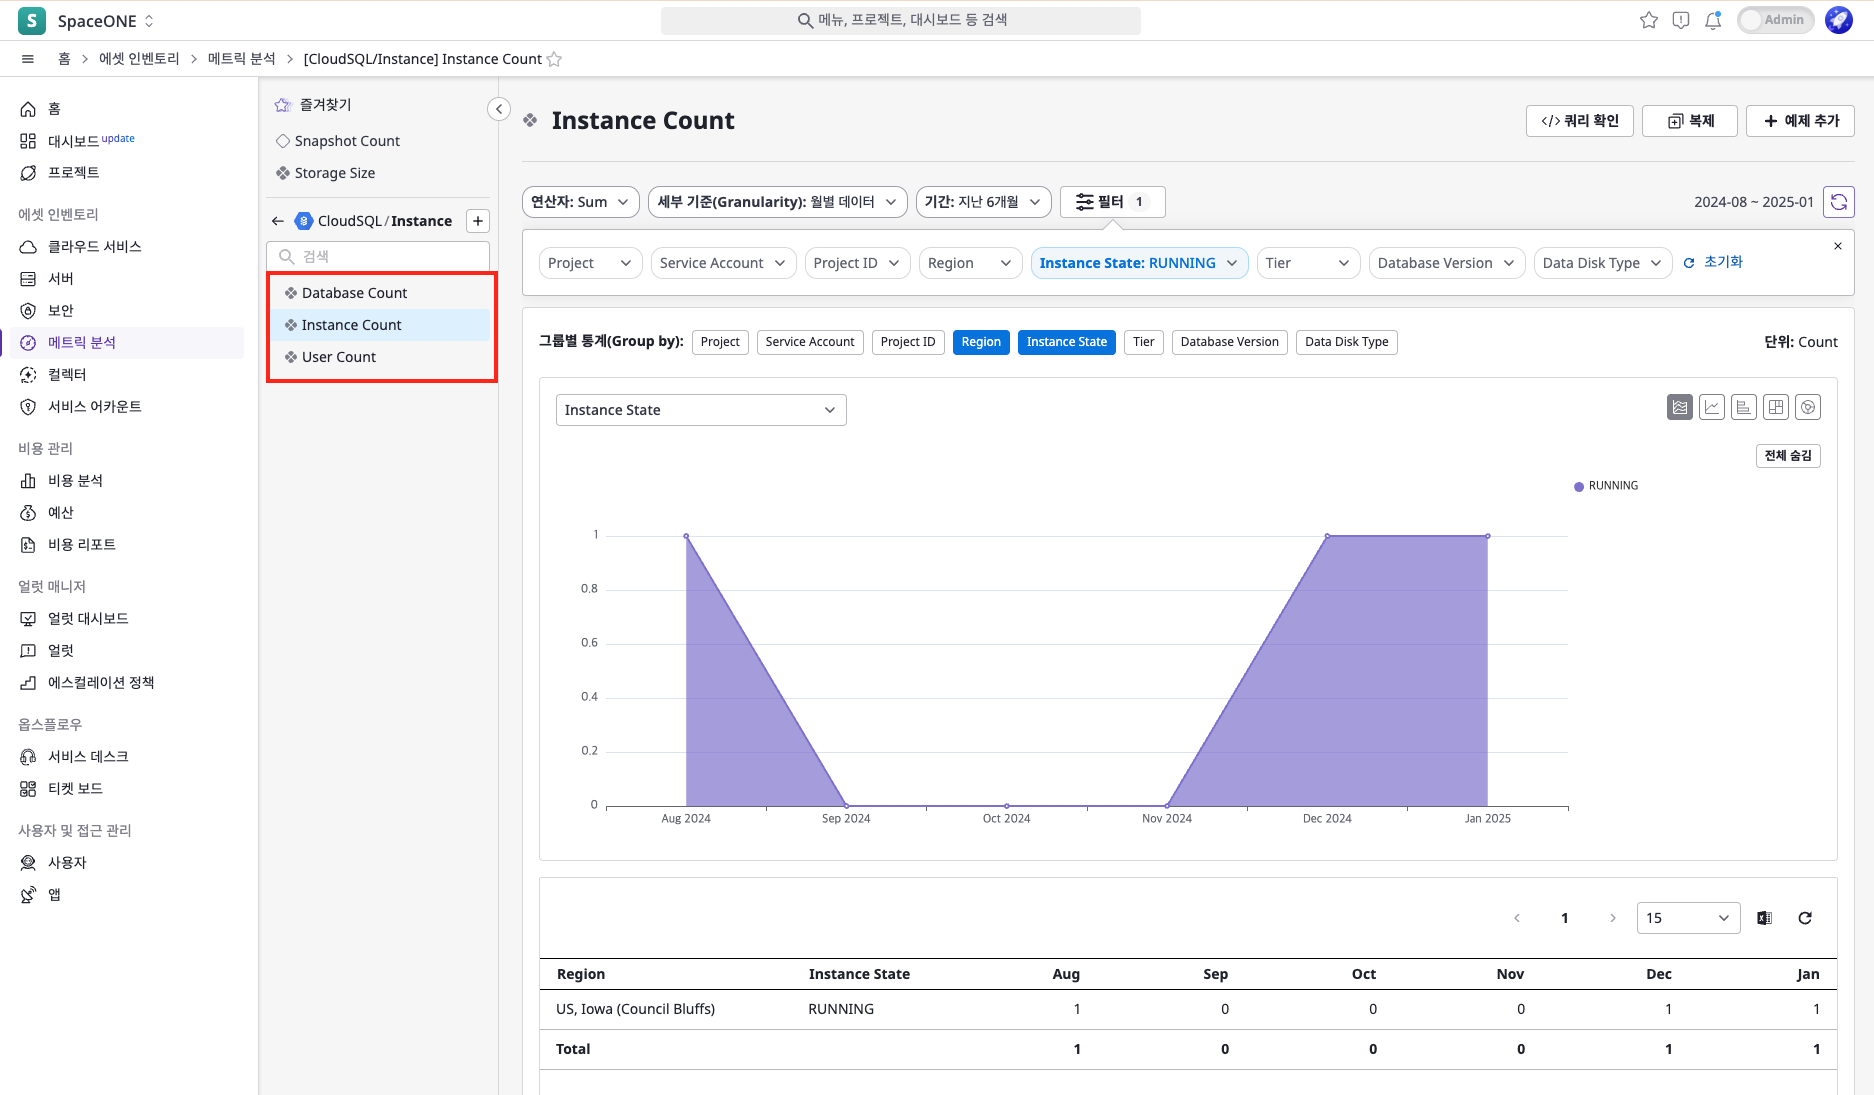
Use options such as operators, granularity, and filters to view metric data according to your desired criteria.
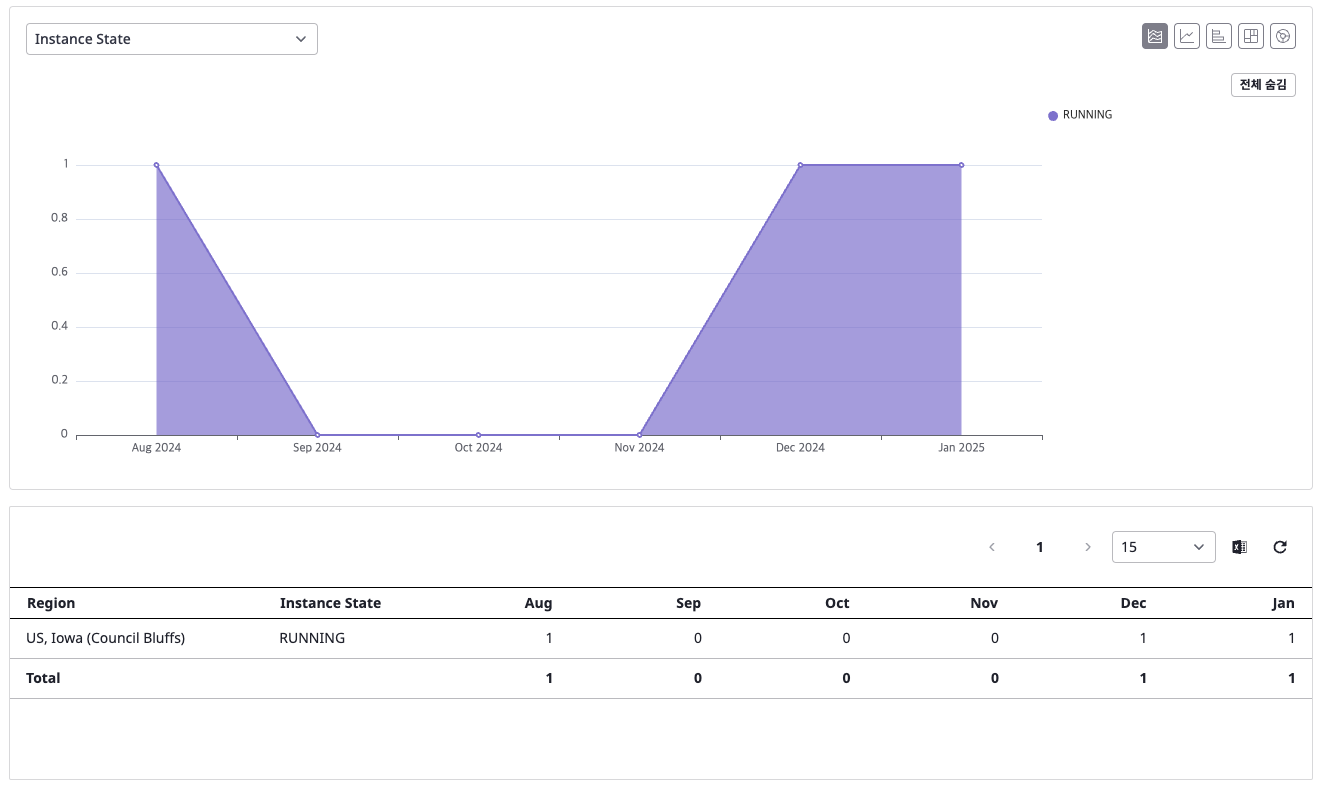
View Charts and Tables
Check the charts and tables for the selected metrics. You can change the chart type using the buttons in the top right.
[Cost Exploration] Cost Analysis
The Cost Analysis page provides detailed analysis of cost data received from cloud providers.
Navigate to Cost Analysis
Go to [Cost Management > Cost Analysis] page and select the Google Cloud data source from the [Data Source] field.
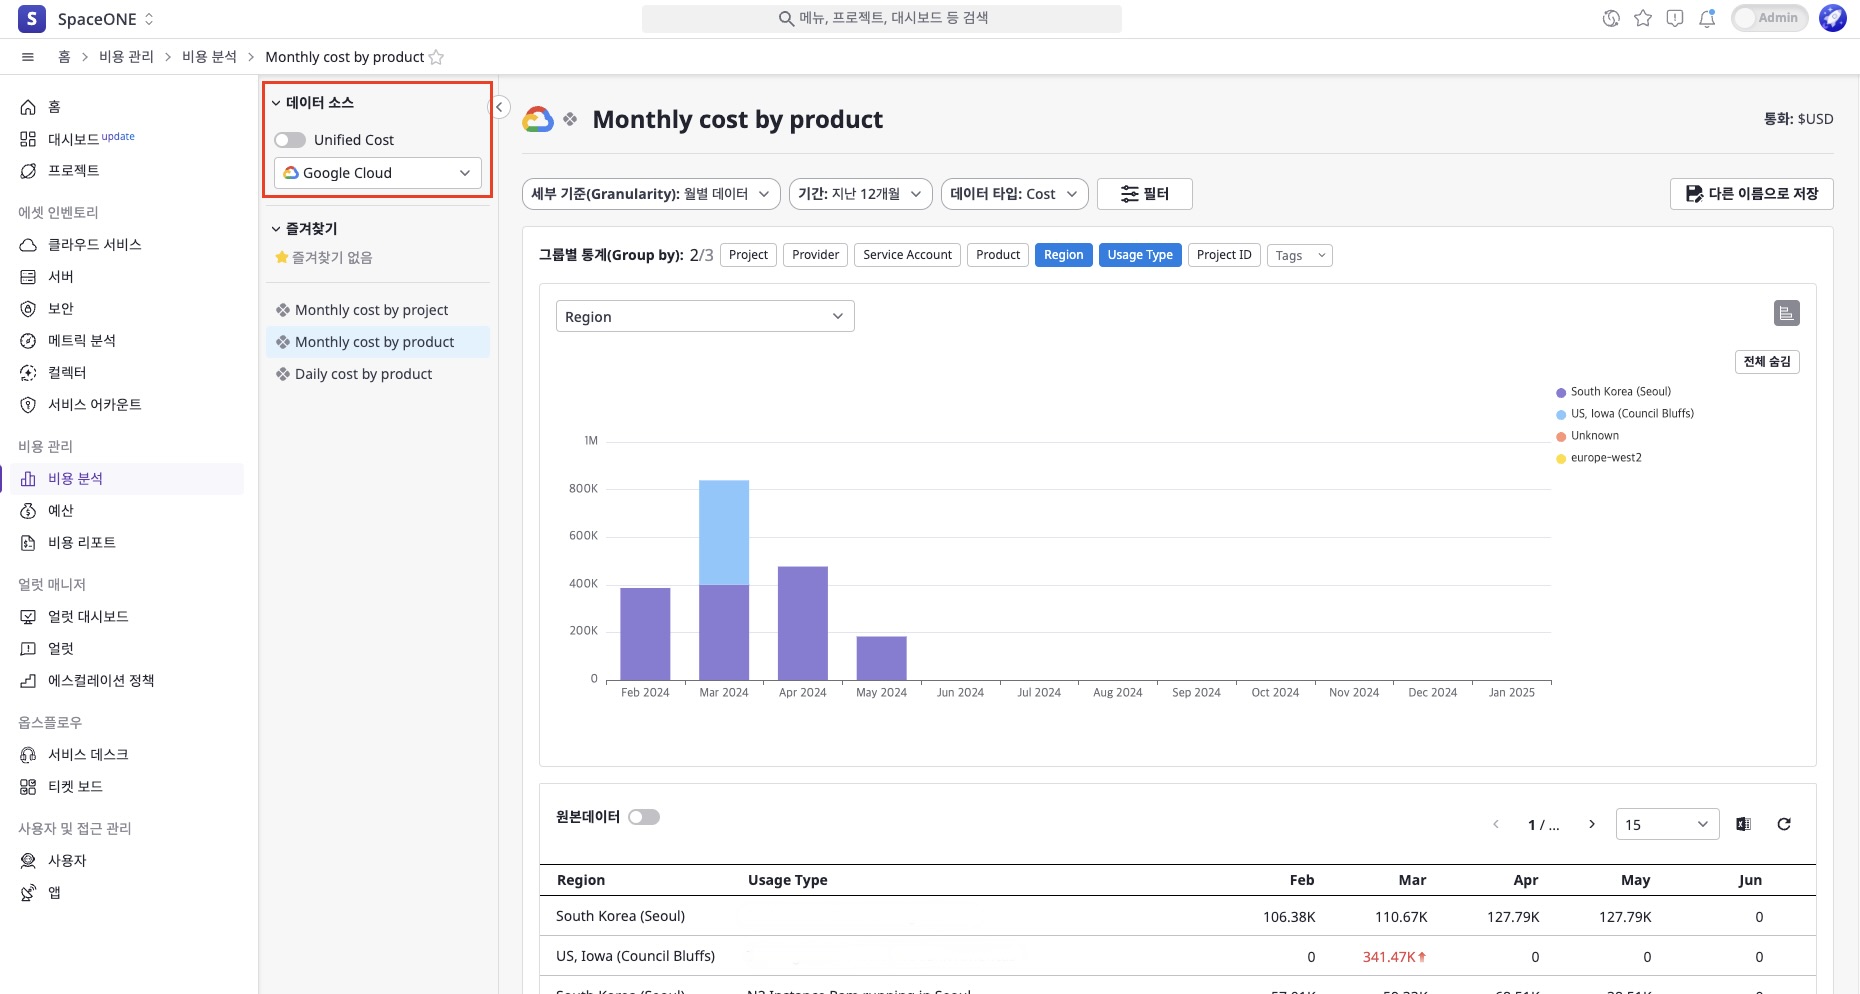
Google Cloud.Select Query and Set Options
Set granularity, period, data type, and other options to view cost data according to your criteria.
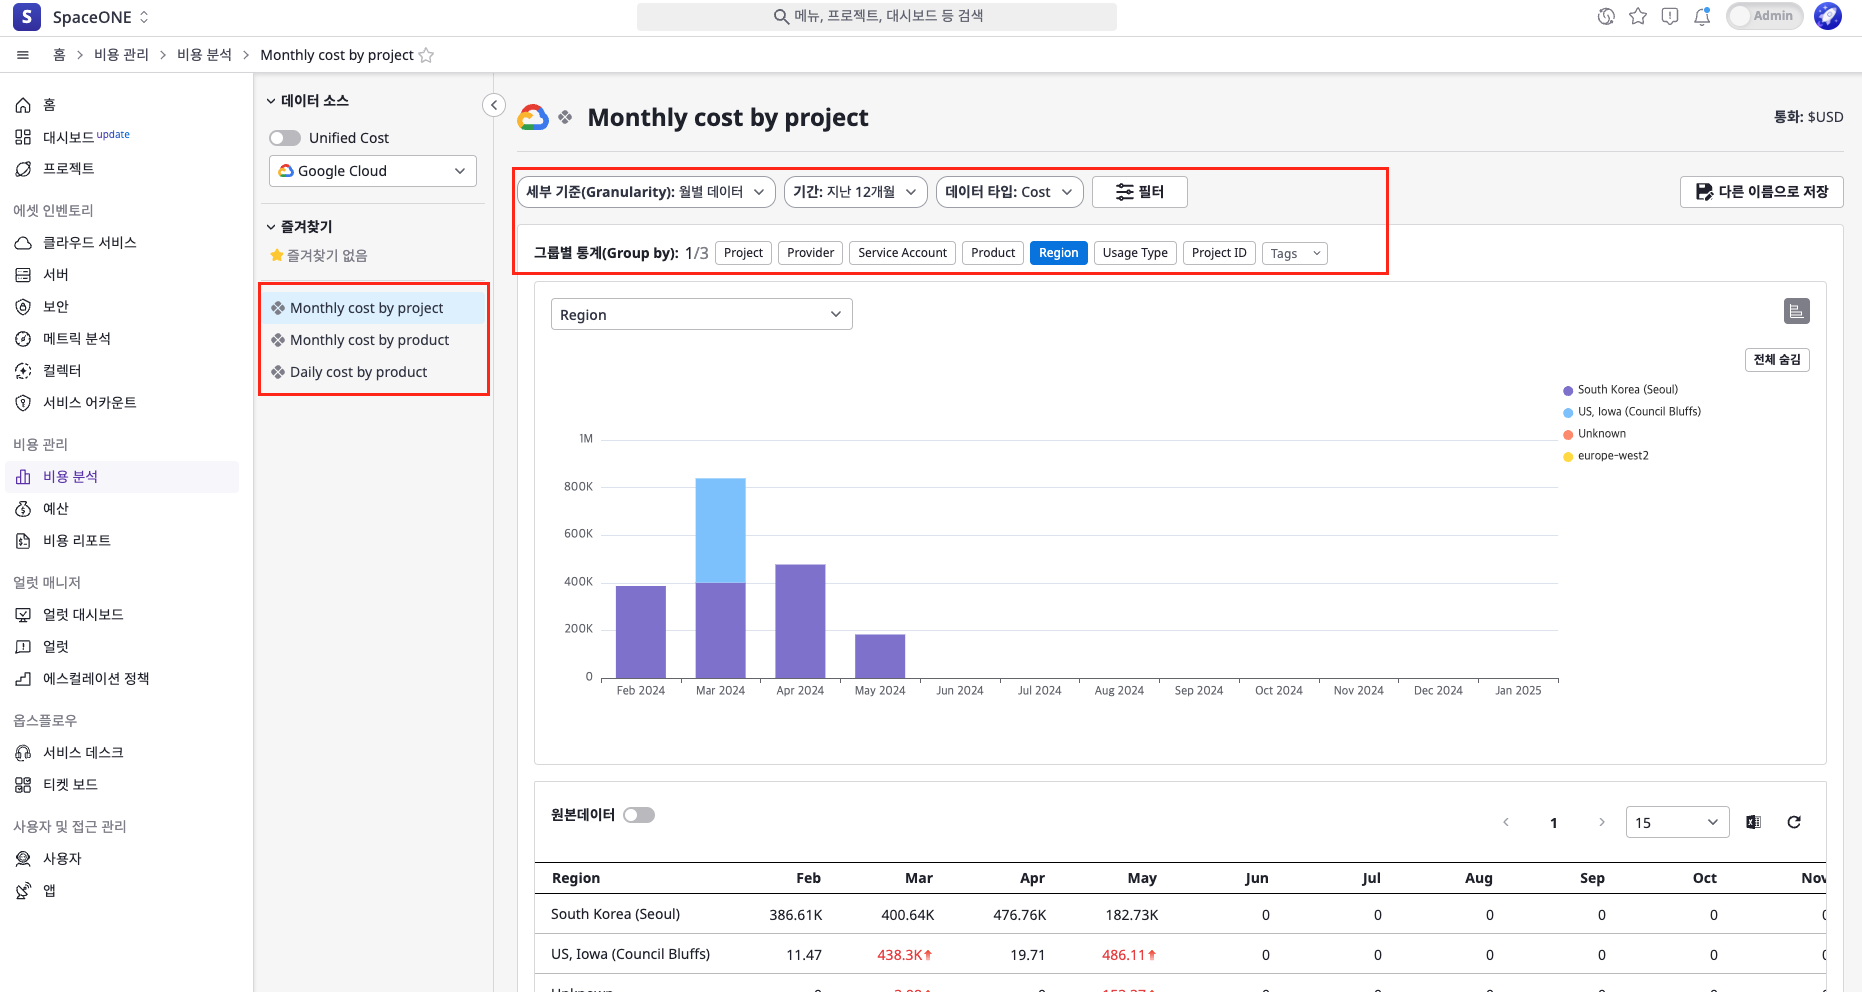
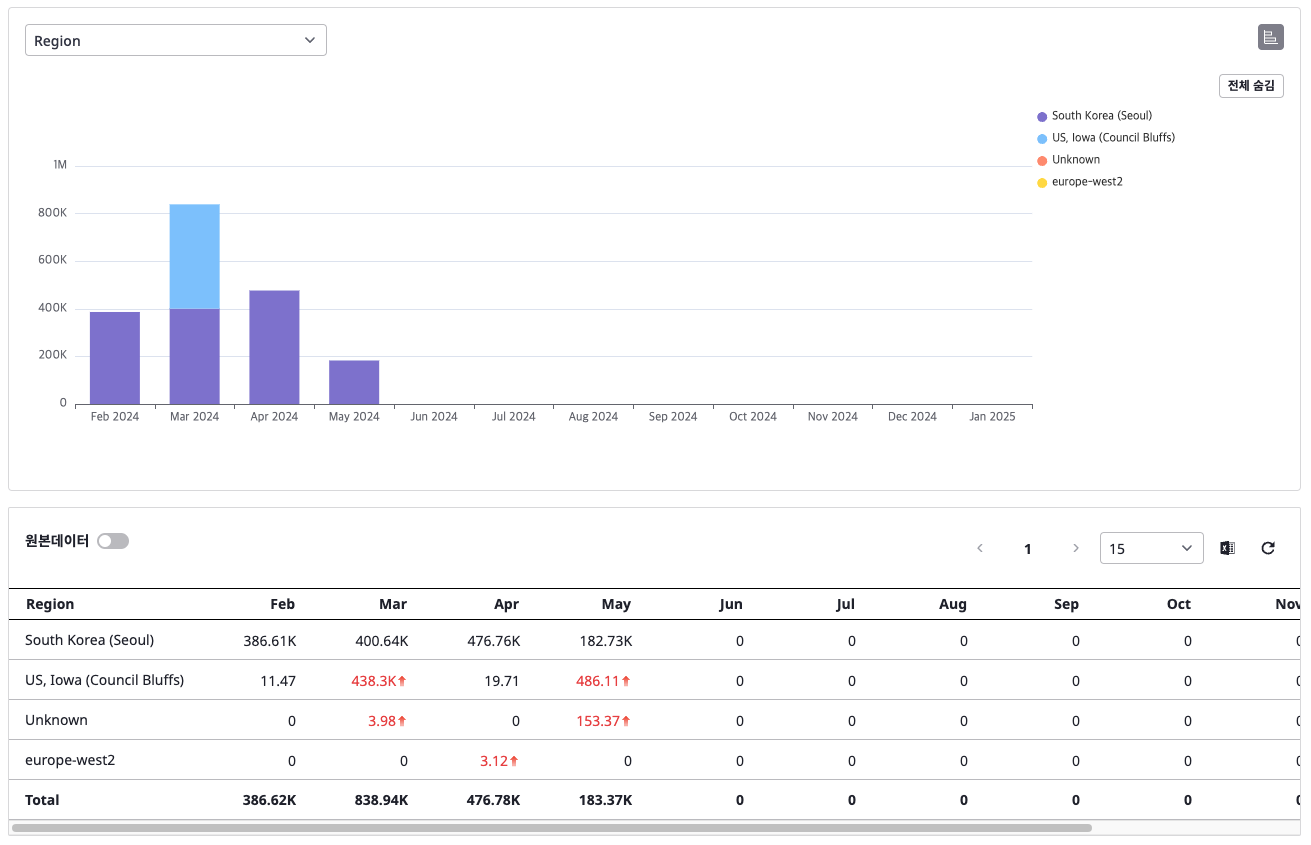
View Charts and Tables
View cost data in charts and tables based on your selected options.
[Resource and Cost Exploration] Dashboard
The Dashboard allows you to view resource and cost data at a glance by adding desired widgets.
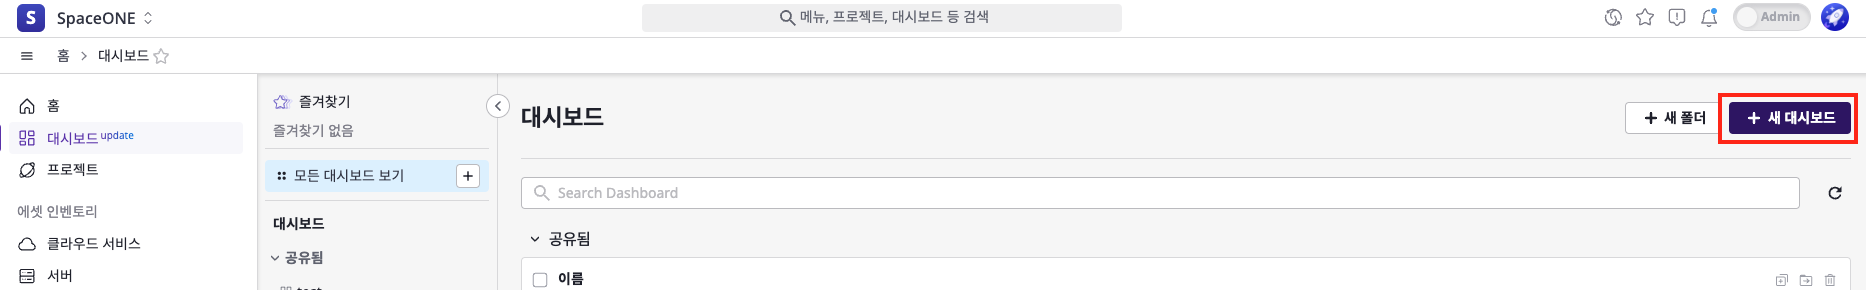
Navigate to Dashboard
Go to the [Dashboard] page and click [+ New Dashboard] to create a dashboard.
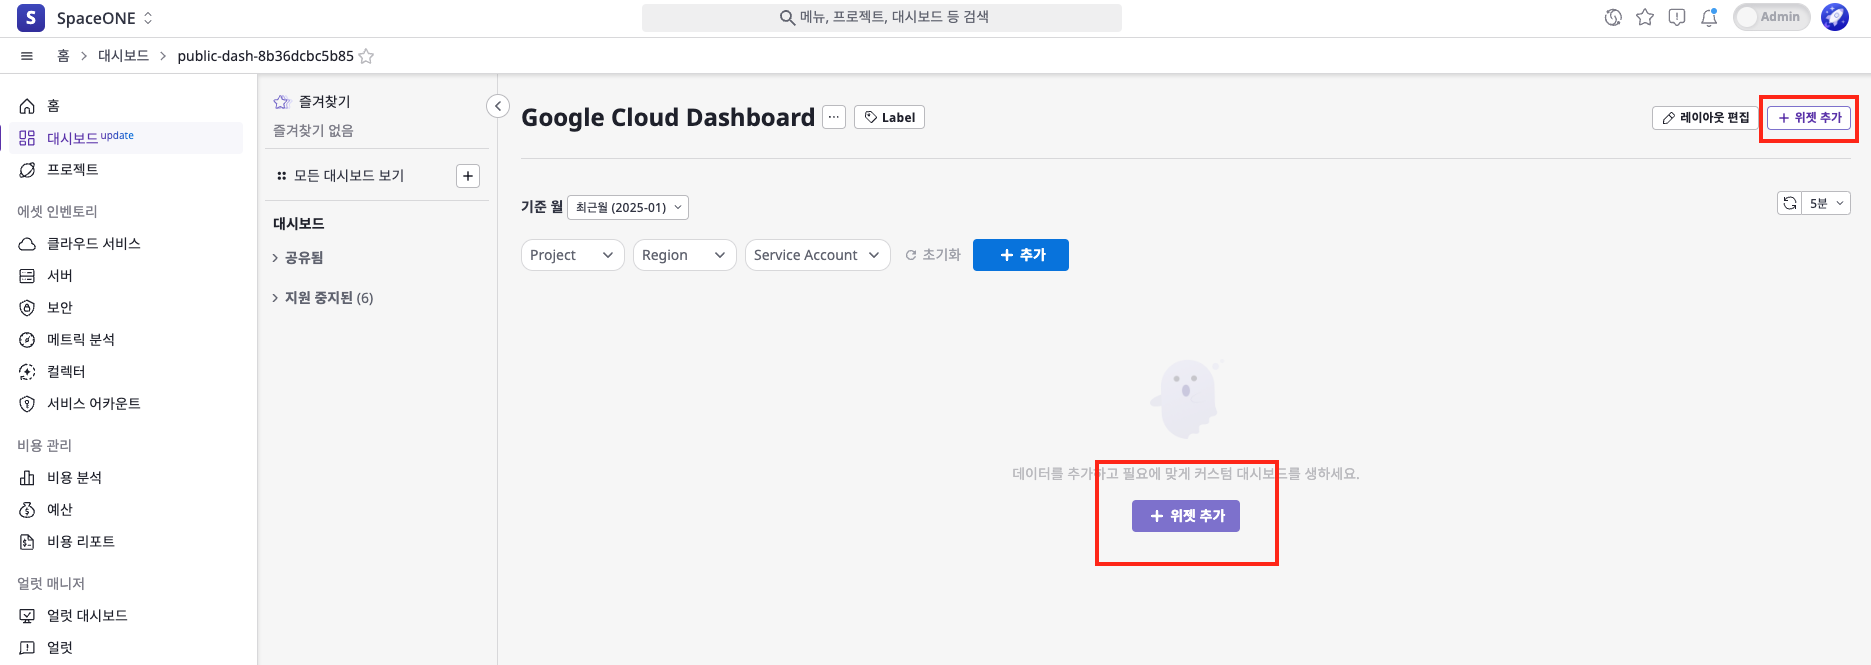
Add Widgets
Click [+ Add Widget] on your created dashboard.
2-1. Configure Data Source
Click [+] button, then click [Add Data].
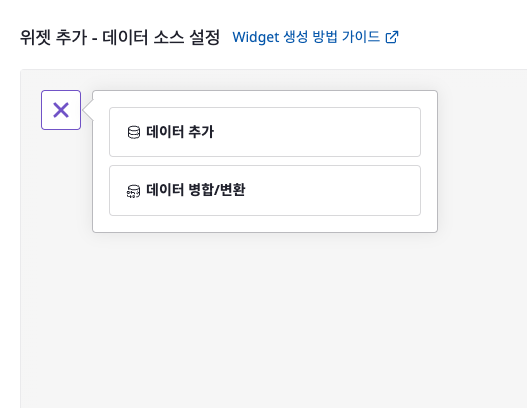
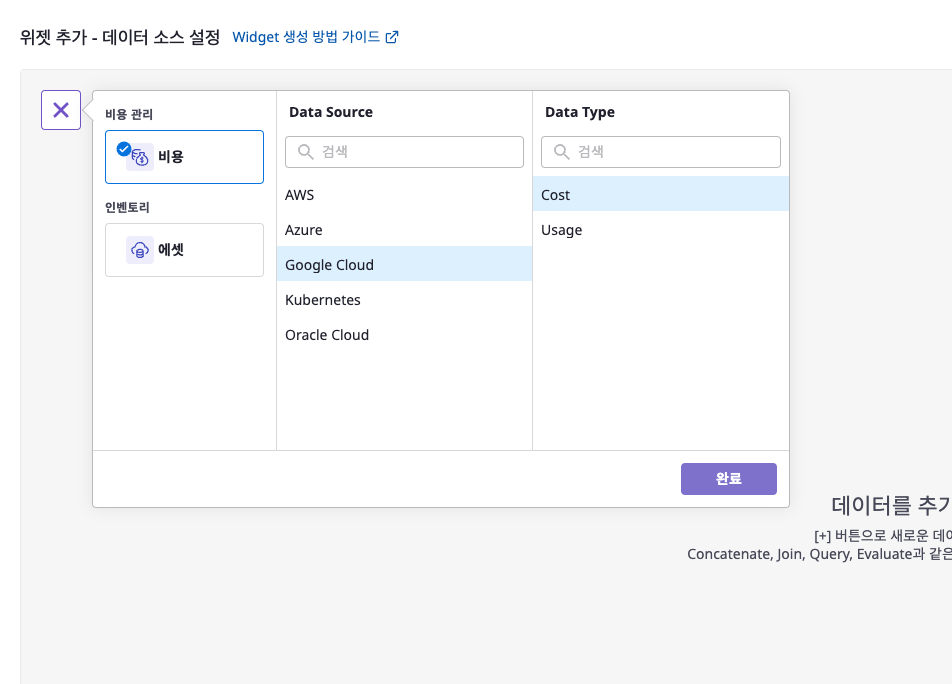
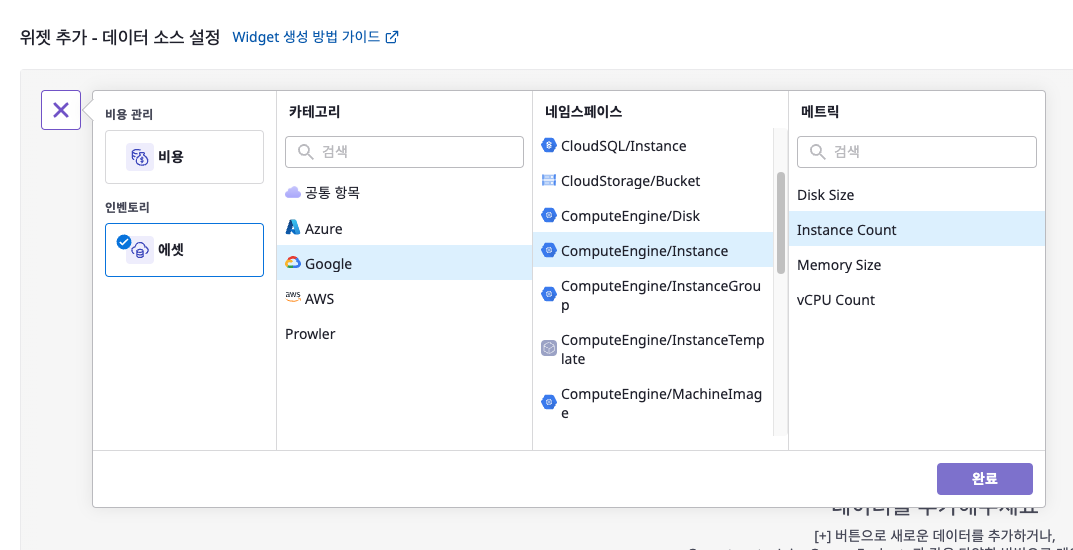
Select either [Cost] or [Asset], then choose your data source.
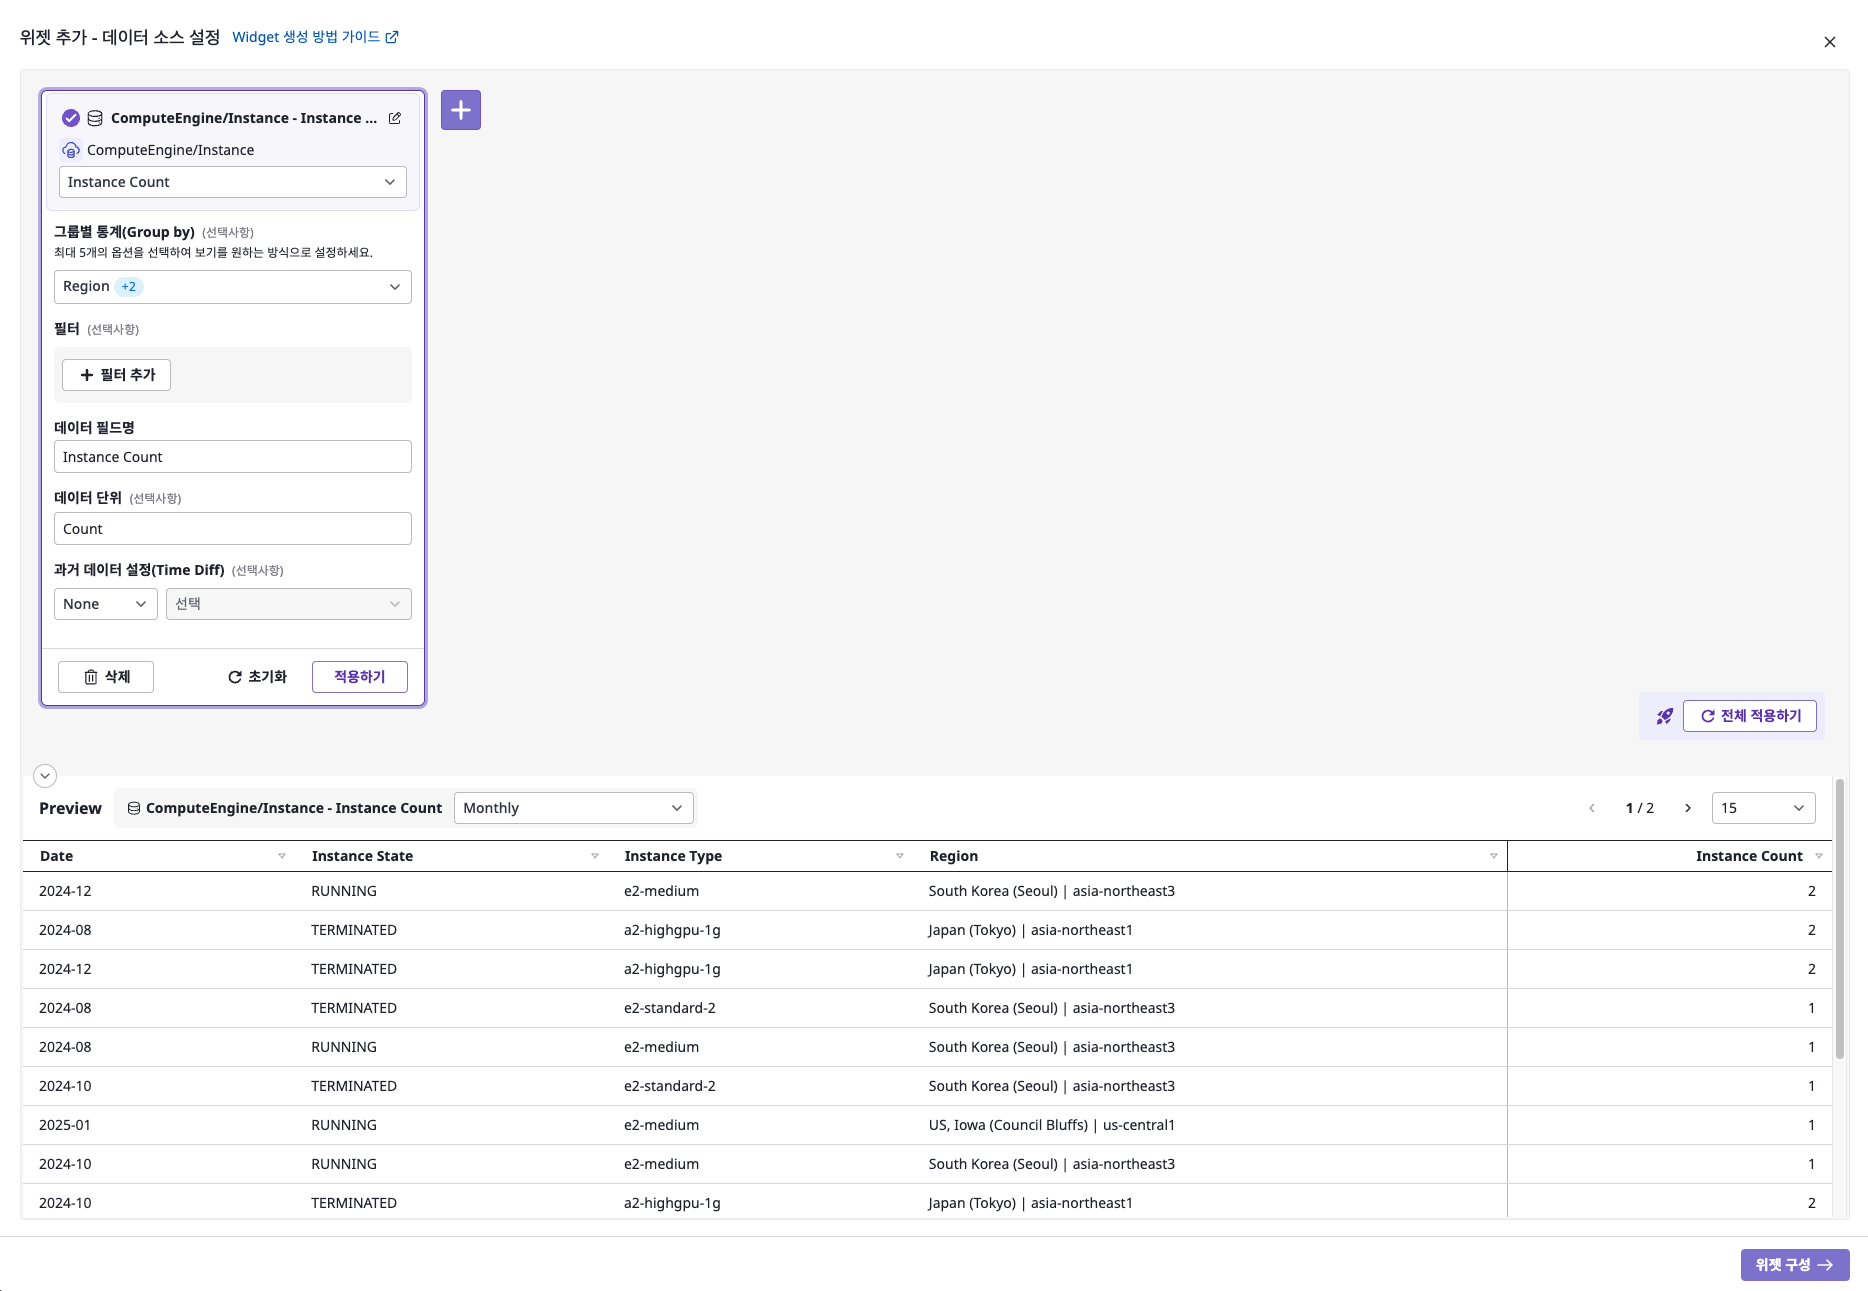
Once completed, a data table will be created. Set necessary options such as group statistics and filters.
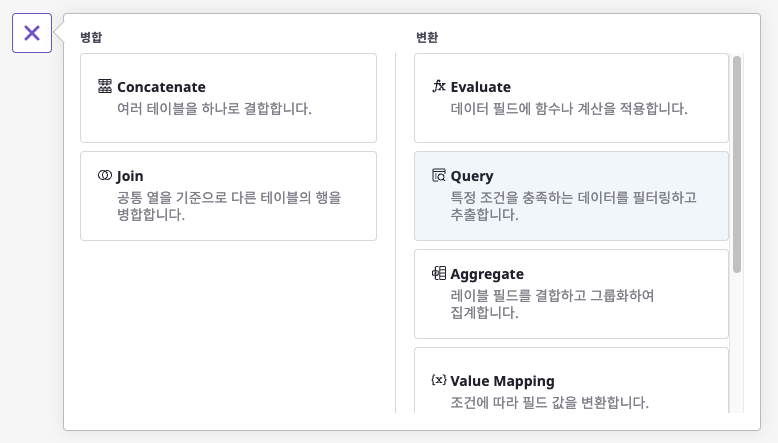
Data Merge/Transform
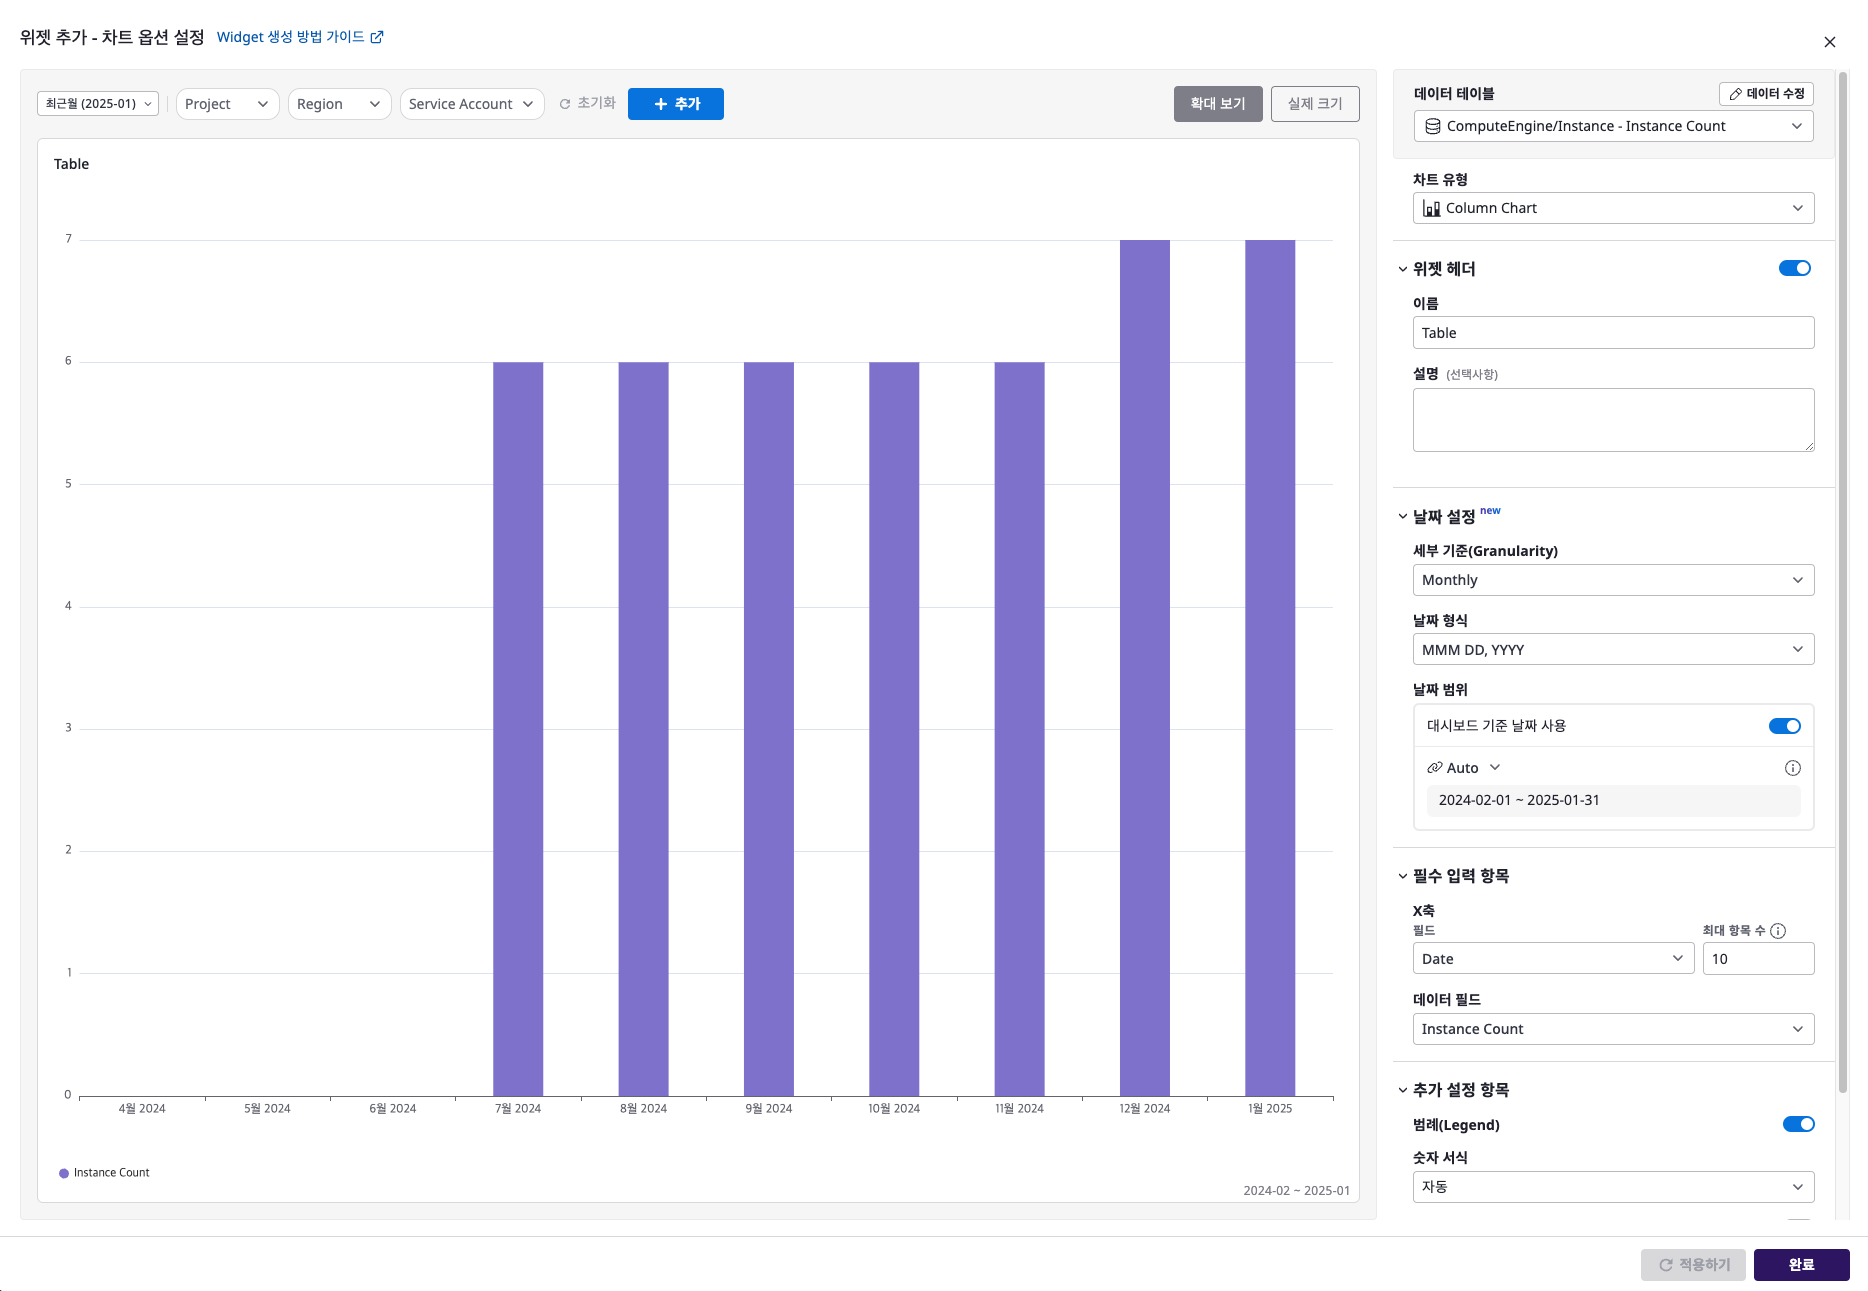
2-2. Configure Chart Options
Create charts based on the data source created in 2-1. Configure Data Source. You can set the chart type, period, and detailed options specific to each chart type.