Create Data Table
A Data Table is a crucial element that forms the foundation data for widgets that visually represent data in dashboards.
Users can create customized data by selecting desired data sources and applying filters and group settings.
Creating a Data Table
There are two methods available when setting up a data table:
Method 1) Add Data: A function to add raw data collected from cloud services. You can select either cost or asset data. - Add cost data - Add asset data
Method 2) Merge/Transform Data: You can create new datasets by combining multiple data sources or transforming specific data.
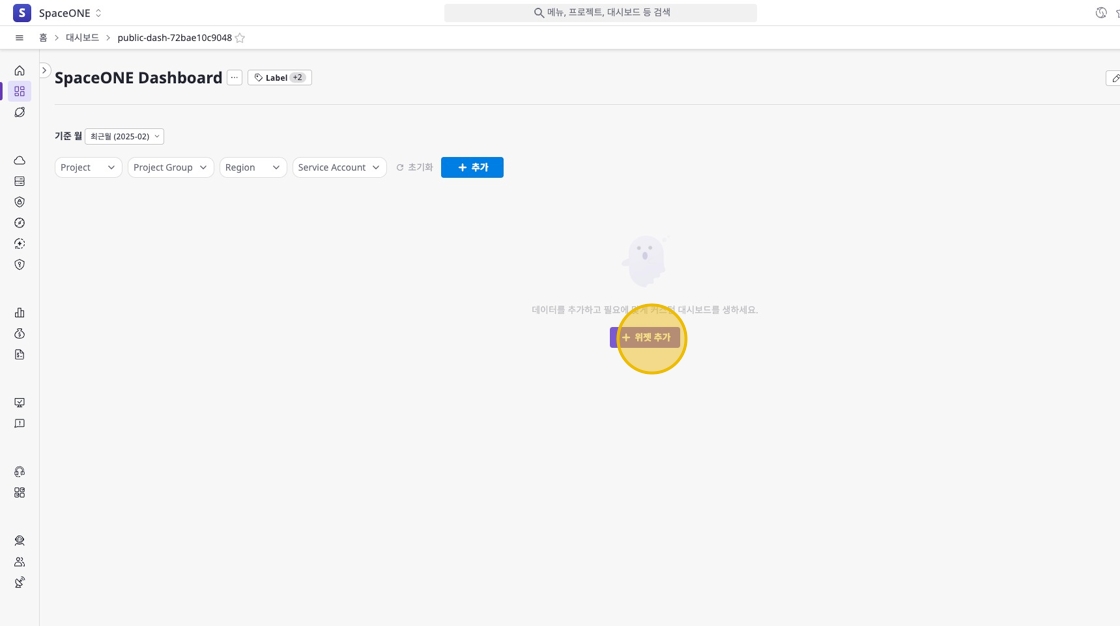
Data tables can be added by clicking the [Add Widget] button on the dashboard detail page.
Method 1) Adding Data
Click Add Button
Click the [+] button in the top left of the data table editing screen.
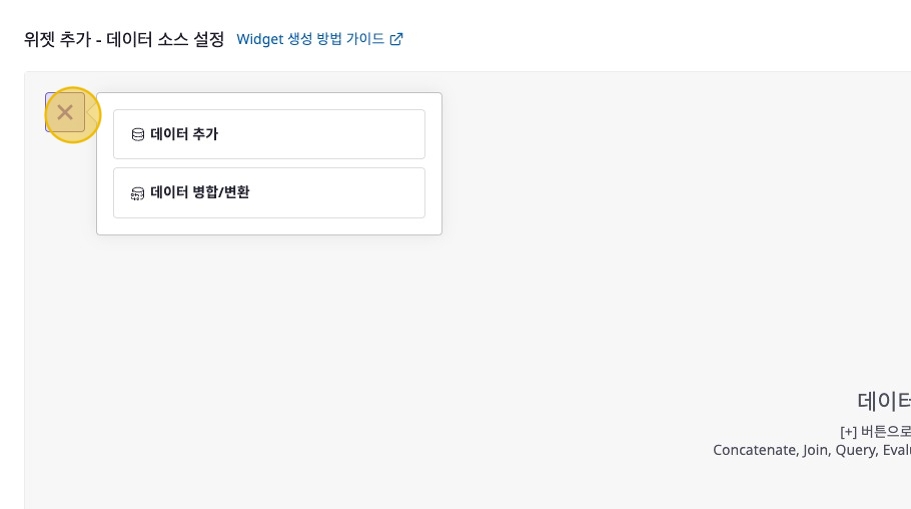
Add Data
Select the [Add Data] button, then choose either Cost or Asset.
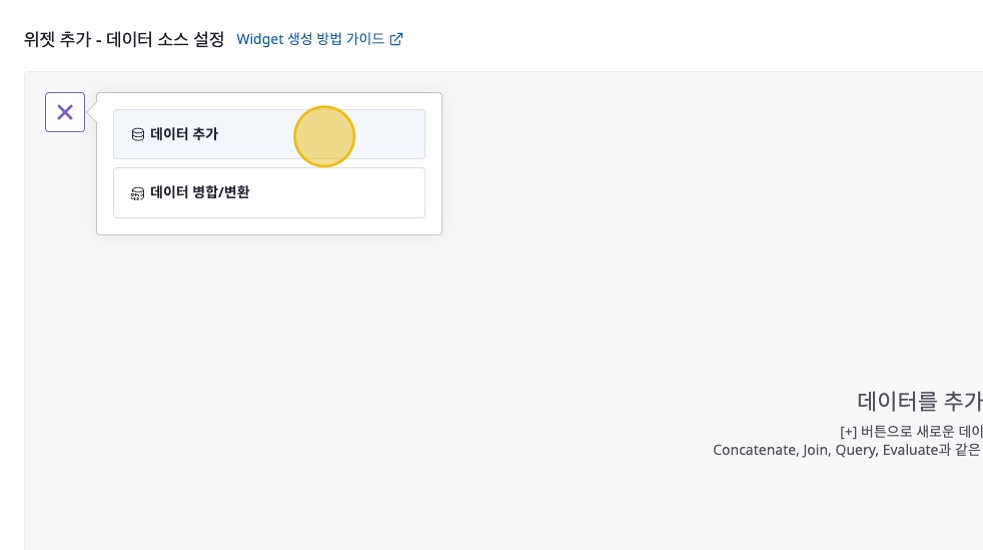
- Add Cost Data
- Add Asset Data
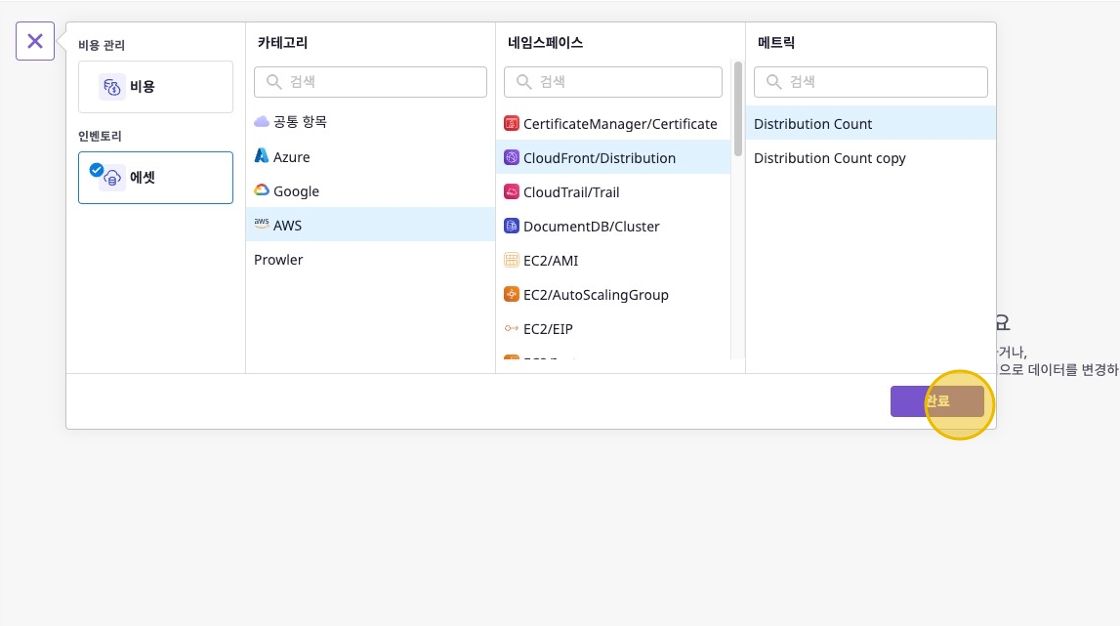
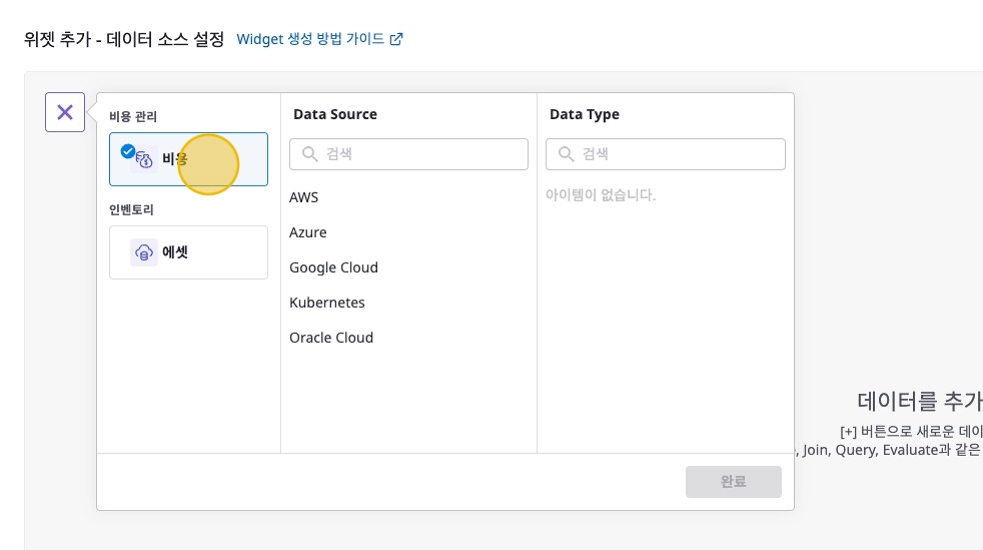
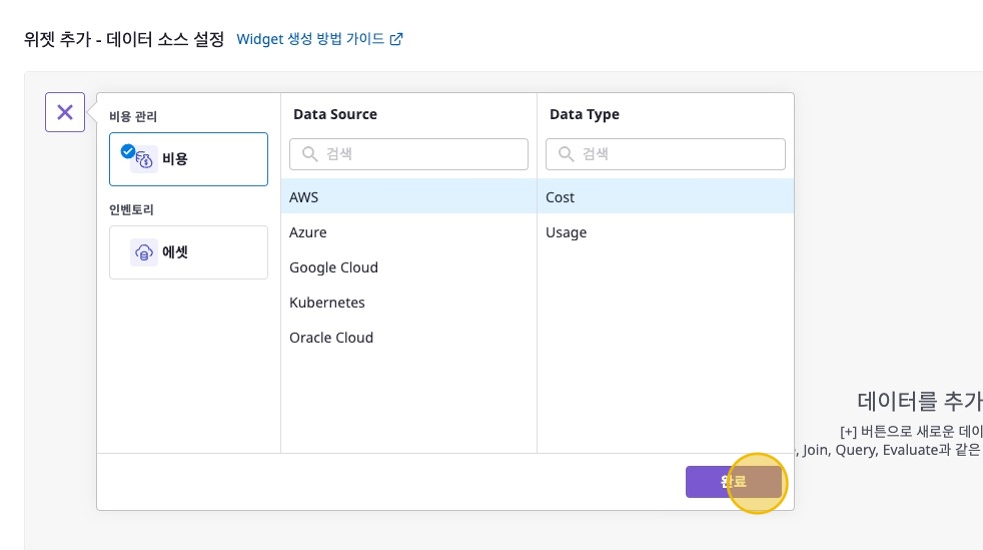
Select Data Source and Data Type
Select the data source and data type, then click the [Complete] button.
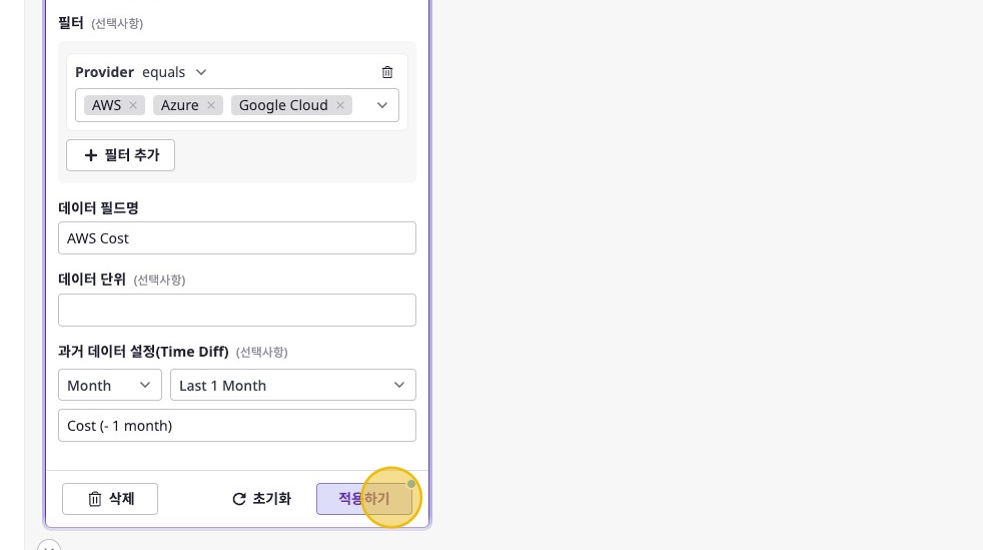
Configure Data Detail Options
You can fine-tune the data table’s data through data detail option settings.

- Group by: Set the criteria for grouping data.
- Filter: Filter data by specific Project, Product, Region, etc.
- Data Field Name: The field names of the selected data source are automatically entered and can be modified as needed.
- Data Unit: Set the unit of data to display in the widget. (e.g., count, core, $, ₩)
- Time Diff: Retrieve historical data from a specific year/month/day before the current date.
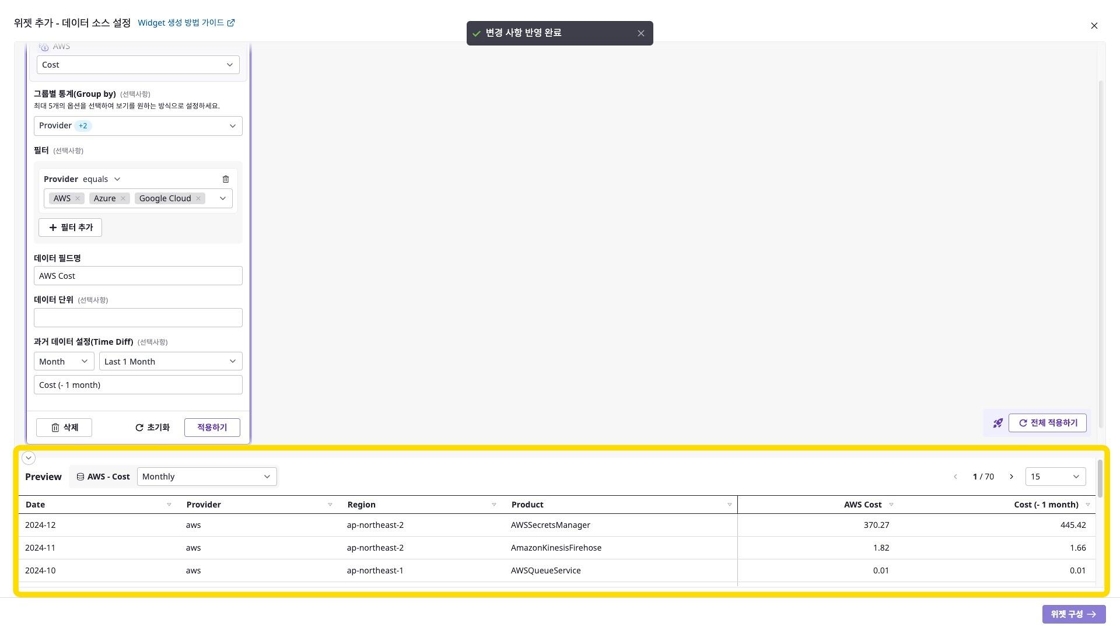
Complete Data Addition
After completing data addition, you can check the data table in the data table editing screen.
Method 2) Merging/Transforming Data
Through Data Merge/Transform, you can create new datasets by combining multiple data sources or transforming specific data.
Add Data Merge/Transform
Click the [+] button in the top left of the data table editing screen, then select [Data Merge/Transform].
![]()
Select Data Merge/Transform Method
Choose how to merge/transform the data.
![]()
Concatenate
Combines two sets of data vertically or horizontally.
![]()
Join
Combines two sets of data according to specified How and On criteria.
![]()
Evaluate
Apply functions or calculations to data fields.
Use Pandas Query for conditions (optional) and Pandas Eval for formulas.
![]()
Query
Filter and extract data that meets specific conditions using Pandas Query. For example, in the following case, only data containing Japan in the Region field is extracted.
![]()
Aggregate
Aggregate by selecting necessary fields from the Group by fields specified during data addition.
![]()
Value Mapping
Transform field values according to conditions.
![]()
- Field Name: Enter a new field name.
- Criteria: Select the field to be used as filtering criteria.
- Condition: Enter the filtering condition.
- Others (Optional): Enter the
Elsecondition. - Additional Condition (Optional): Enter additional conditions.
Additional Labels
Add labels to improve data clarity.
![]()
Pivot Table
Transform specific data into pivot data according to reference fields.
![]()
Complete Data Merge/Transform
After completing data merge/transform, you can check the data table in the data table editing screen.
![]()